
Written by: McFadyen Digital
Reading time: 3 minutes
Updated: 07/01/2026
Published: 07/28/2023
A Detailed Look At The Amazon Prime Day 2023 Data Based On Numerator’s Prime Day Tracker
INTRODUCTION
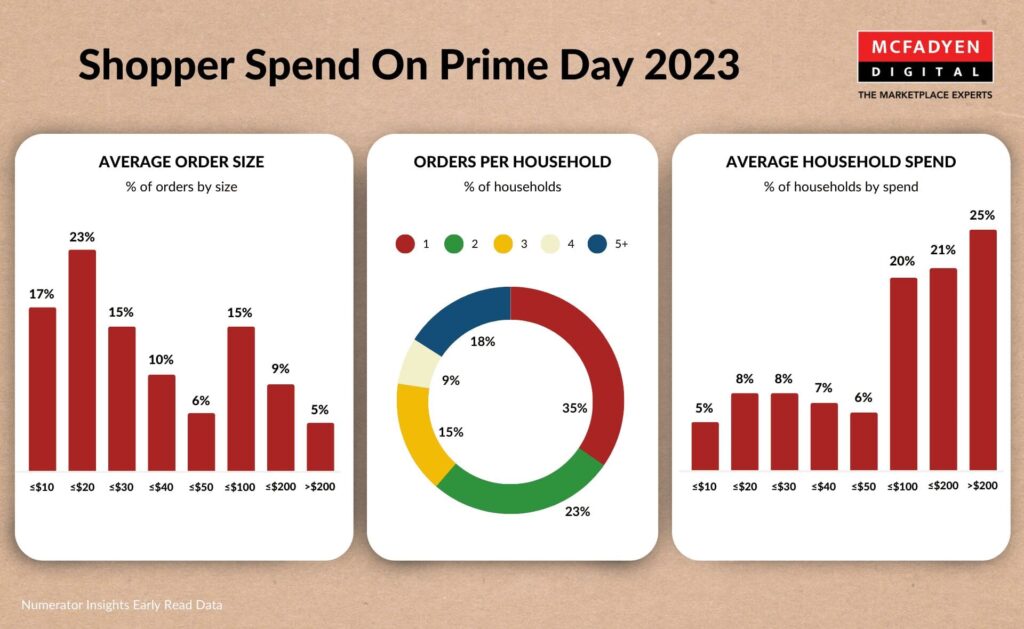
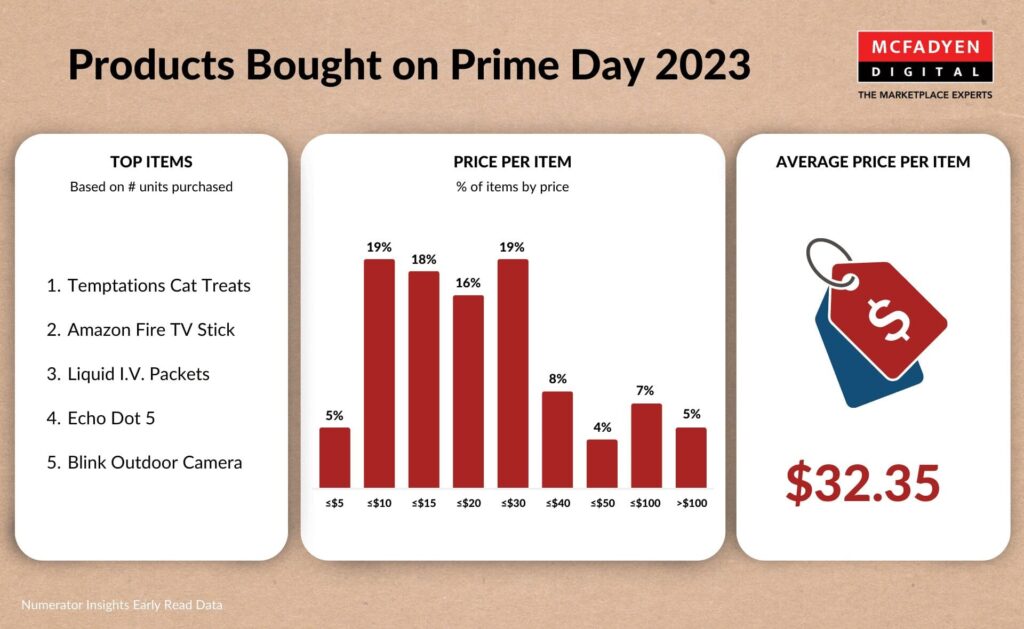
The best sellers in an early read of the Prime Day 2023 were Temptations Cat Treats, Fire T.V. Sticks, and Liquid I.V. Packets. The top categories purchased by the shoppers during this period were home goods at 28%, household essentials at 26%, and apparel and shoes at 24%. Over 50% of Prime Day shoppers mentioned that they purchased items they’d been holding off on buying until they were on sale. Over 50% of the items sold during Prime Day were under $20, and only 5% were above $100. Overall the average spend per item stood at $32.35.
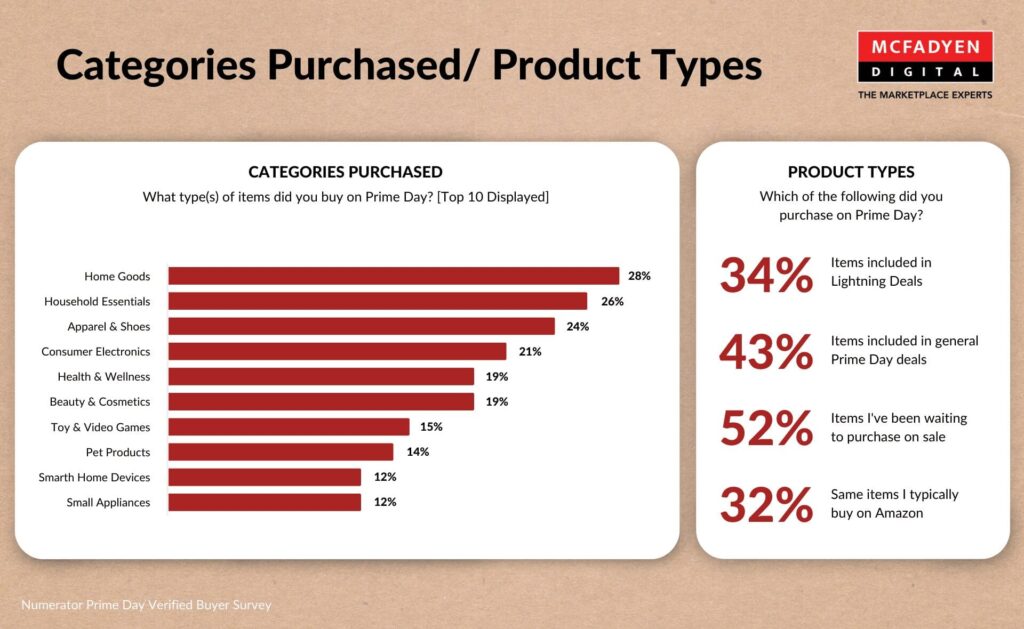
While Home Goods was the biggest category, Pet Products, Small Home Devices, and small appliance collectively accounted for over 36% of the Prime Day sales. Of all the different deal types, Lightning deals accounted for 34% of the sales, whereas Prime Day deals accounted for 43% of the sales. A Lightning Deal is a promotion in which a limited number of discounts are offered on an item for a short period. Only 32% of the respondents said they bought the same items they typically buy on Amazon.
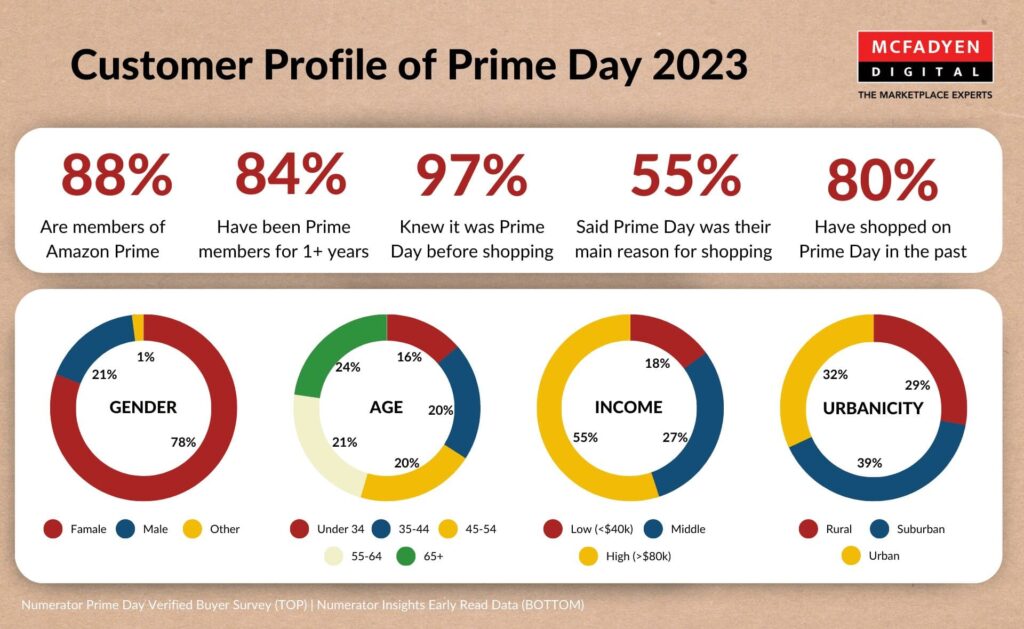
The available data shows that the typical shopper for Prime Day 2023 was a high-income, suburban female aged 35 to 44 years. Off all the surveyed shoppers, 88% were Prime members for a significant period, over 73% were since 2019 or earlier, and 84% for just a year. Almost all (97%) were aware of the Prime Day Shopping Festival before shopping on Amazon during the sale, and over 80% had shopped during such events in the past.
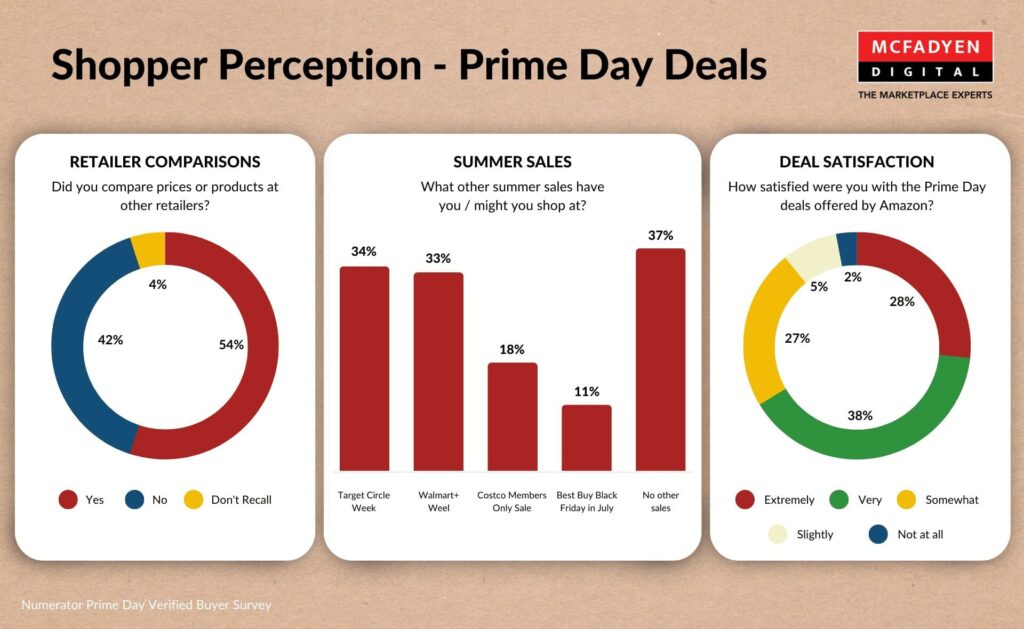
Regarding retailer comparison, close to 54% of shoppers mentioned comparing products and prices before buying something on Amazon Prime Day sale, while 42% said no, they don’t. The other retailers where they compared the prices included Walmart at 36% and Target at 25%. Regarding the other major Summer Sales, 34% of Prime Day shoppers said they might shop Target Circle Week, 33% Walmart+ Week, and another 37% said they wouldn’t shop any other sales. 28% of the Shoppers said they were extremely satisfied with the Prime Day deals offered, whereas 27% were somewhat satisfied, and a meager 2% were not satisfied by the deals.
Talk to our Marketplace Strategy Experts to start your own marketplace journey today. For further information on the Numerator’s Prime Day Tracker sign up for their Full Prime Day 2023 recap report coming soon!
Related Articles


Turn Insight Into Impact.
Start Today.