Written by: McFadyen Digital
Reading time: 6 minutes
Updated: 10/22/2026
Published: 10/22/2026
How commerce teams close decision latency with governed data and explainable models on Databricks.
TL;DR:
- Dashboards explain the past. The gap between what happened and what to do about it is decision latency, and in commerce it can run to days or weeks.
- Closing it takes three things: a governed data foundation, context beyond your own transactions, and models that explain themselves.
- You don’t need more charts. You need one trusted view of the customer, shared definitions, and recommendations people can inspect.
- We built this on Databricks as the McFadyen Commerce Intelligence Accelerator: churn risk, account growth, marketplace seller risk and demand signals, each with the reasons and a recommended next step.
- Start with decisions that are frequent and valuable. Not with a model.
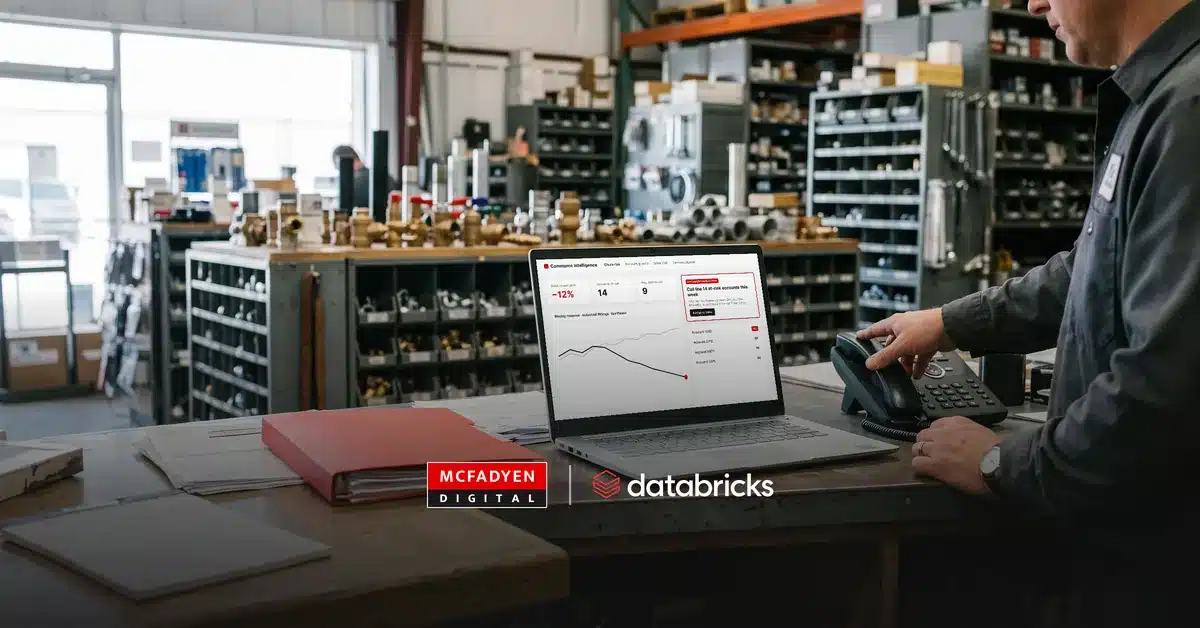
A dashboard can tell you sales fell 12%. It can show which products declined, which regions were hit and how that compares with last year. Then someone still has to ask: Why did it happen? What happens next? What do we do about it?
That gap has a name: decision latency. It is the time between something happening in your business and the right person having the right context to act. In commerce and marketplace businesses, where customer behavior can shift inside a single order cycle, it is the difference between an account you save and one that quietly leaves.
At McFadyen, we close that gap with governed data and explainable models on Databricks. This article shows what that looks like, and where to start. If you would rather see where you stand first, take the free AI Commerce Readiness Audit.
The Dashboard Is Not the Problem. It Stops Too Soon.
Picture a B2B dashboard showing one customer segment’s orders sliding for three straight months. Fewer purchases. Slower reorders. Smaller baskets. Similar customers are buying normally.
“Sales are down” becomes “something changed, and we don’t know why.” That moment repeats everywhere: an account going quiet, a seller missing delivery targets, a category losing share. Then comes the question that stops most teams: does this need action?
Traditional reporting runs out of answers right here.
Context Changes the Question
A customer buying less does not mean that customer is leaving. Their industry may be soft. A competitor may have moved in. Inventory may have been unavailable. Or they placed a big order last month.
Internal data alone cannot tell these apart. Add external signals (market trends, economic indicators, industry data) and the question gets sharper. Not “why did this customer buy less?” but “is this decline specific to this customer, or is the whole market moving?”
The answer changes the response. A customer-specific drop calls for a call from the account manager. A market-wide drop calls for something else entirely.
Where Business Intelligence Goes Next
Most organizations can place themselves on this path, and most are strong at the first two steps and stop there.
| Stage | Question it answers |
| Descriptive | What happened? |
| Diagnostic | Why did it happen? |
| Predictive | What may happen next? |
| Prescriptive | What should we consider doing? |
| Governed action | Can we put the recommendation into a workflow, with a person signing off? |
| Closed-loop learning | Did the action improve the outcome? |
The work is not adding more dashboards at the top of this table. It is building the foundation that lets you move down it without losing trust at each step. The dashboard stays. It becomes the interface to a decision system, not the destination.
Build the Foundation Before the Model
You don’t have an AI problem. You have a data problem.
If one customer exists in three systems under three IDs, the model sees fragments. If product definitions differ between ERP and commerce, product analysis misleads. If your history has gaps, trends lie. If no one can explain where a recommendation came from, no one will use it.
A governed lakehouse platform like Databricks can bring ERP, commerce, marketplace and CRM data into one business model. The goal is not another data store. It is consistent business context: one Customer 360 that resolves duplicate records, shared KPI definitions, and governance on every table and model.
That is the layer we built into the Commerce Intelligence Accelerator. It connects the systems a commerce business already runs, with business logic on top, so the output is trustworthy and not just technically correct. It is the same foundation behind our Data, AI & Decision Intelligence work. For the master-data side of this problem, see our post on why B2B customer hierarchy is never one record.
What a Prescriptive Dashboard Looks Like
Instead of only “Customer revenue: down 18%,” the same signal arrives in layers:
| Layer | Example |
| Signal | Customer revenue is down 18% |
| Context | Similar customers and category demand are stable |
| Explanation | The drop looks customer-specific, not market-driven |
| Risk | Elevated churn risk, with the main reasons |
| Recommendation | A sales review and replenishment conversation |
| Action | A follow-up task prepared for the account manager to approve |
People still make the call. The system does more of the investigating before the question reaches them. And users can ask follow-up questions in plain language through Databricks Genie, on the same governed data, with the same access controls.
Want to see how your data stacks up? Take the free AI Commerce Readiness Audit. No sales call required.
Use the Simplest Model That Earns Its Place
Different questions call for different models, and the choice matters less than the discipline around it. We follow three rules:
1. Match the method to the evidence. Where you have a history of outcomes, such as customers who left, train a model. Where you do not, start with a transparent weighted score built from business knowledge.
2. Make every model earn its place. A trained model goes live only when it beats the baseline on data it has not seen. If it doesn’t, the simple score stays.
3. Explain every score. Every score ships with its reasons and a recommended next step. Not just a number.
Here is how that plays out across the four use cases in the accelerator today.
| Use case | Business question | How it is scored |
| Churn risk | Which customers may leave? | Trained model (XGBoost), promoted only if it clears a set bar on held-out data. 0-100 score with the main reasons. |
| Account growth | Which companies may spend more? | Trained models tested against the weighted business score. Used only if they win. |
| Marketplace seller risk | Which sellers may miss delivery or service targets? | Transparent weighted score: seller performance, buyer feedback, financial health, operations. |
| Demand signals | Which categories may surge? | Weighted score: commodity prices, freight, weather, economic indicators, internal demand. |
Every model version is tracked in MLflow and Unity Catalog. Churn scores are calibrated, so a 70 means roughly the same risk every time. Business rules can override a score when your team knows something the data does not. Drift is monitored, so you see when behavior changes. If you run a marketplace, the seller-risk use case pairs naturally with our marketplace enablement work. For a sense of what dashboard intelligence looks like in practice, see how we approached an online chemicals marketplace and a distributor analytics project for Bay Supply.
Where to Start
None of this happens at once. Teams making real progress start in the same places:
1. Pick the right decisions. Frequent, valuable and already data-driven.
2. Agree on definitions first. Define KPIs and business rules once, across teams, before adding prediction.
3. Build the 360 views. Customer, product and order foundations everything else depends on.
4. Start simple, then prove it. Use the simplest model that works. Move up only when a better one proves itself.
5. Explain before you automate. A system that shows its reasoning earns trust faster than one that just acts.
6. Measure outcomes. Judge recommendations by results, not just accuracy.
Weak governance makes every later stage harder to trust. That is why we built on Databricks, with Unity Catalog governing the data and models underneath.
The Question to Ask Your Team
It is no longer “Do we have enough data?” It is: can our data help our people decide what to do next?
The winners will not have the most dashboards. They will turn trusted data into faster decisions and measurable results.
Find Out How Long Your Decision Latency Really Is
Take the free AI Commerce Readiness Audit and see where your data foundation stands. Get My Free Readiness Audit
Or talk to our team about a decision intelligence working session. Get in Touch
Frequently Asked Questions
What is decision latency?
Decision latency is the time between something happening in your business and the right person having the context to act on it. It is not report build time. It includes the time spent investigating why, deciding whether it matters, and choosing a response.
How is prescriptive analytics different from a dashboard?
A dashboard reports what happened. Prescriptive analytics adds why it happened, what is likely next, and a recommended action, each with its reasoning. Dashboards still matter for monitoring and agreed KPIs. They become the interface to a decision system.
What is the difference between predictive and prescriptive analytics?
Predictive analytics estimates what may happen next, such as which customers are likely to leave. Prescriptive analytics goes one step further and recommends what to do about it, with the reasons. Both build on descriptive and diagnostic analytics.
What is decision intelligence?
Decision intelligence connects trusted data, context, models and recommendations so people can decide faster and with more confidence. In commerce, that means turning signals like a slowing account into an explained risk and a suggested next step.
Do we need Databricks to do this?
No. The principles work on any governed data platform. We build on Databricks because Unity Catalog governance, MLflow model tracking, AI/BI dashboards and Genie sit on the same governed tables, which makes the result easier to trust and audit. See our partnerships.
Where should a commerce team start?
With the decisions, not the model. Pick a few that are frequent and valuable, such as which accounts to call this week. Agree on the KPIs behind them, build the customer view, then add the simplest model that works. Our AI Commerce Readiness Audit is a fast way to see where your gaps are.
Does this replace our analysts?
No. It does the first round of investigation so analysts and account managers spend their time deciding and acting. People still make the call.
Can we trust a score from a model?
Only if it can show its work. Every score in our accelerator carries the main reasons and a recommended next step. A trained model goes live only when it beats a simple baseline on data it has not seen, and drift is monitored after launch.
Does this work for marketplaces and B2B, not just retail?
Yes. Those businesses have rich data: customers, sellers, orders, inventory and fulfillment. The accelerator includes seller risk and account growth use cases for exactly this reason. See our work in marketplace enablement and B2B and complex commerce.
How do we get started with McFadyen?
Get in touch or start with the free readiness audit. No sales call required.
Related Articles

Turn Insight Into Impact.
Start Today.