
Written by: McFadyen Digital
Reading time: 4 minutes
Updated: 07/01/2026
Published: 12/09/2022
INTRODUCTION
Cyber week is behind us, and despite many challenges like the ongoing economic downturn, rising inflation rates, and ongoing supply chain issues, the sale was still a record-breaking shopping event. This blog will give you the lowdown on Cyber Week 2022 results with stats, trends, and data, plus insights with an information-packed infographic that covers the broader Holiday Shopping period of Nov 1st to Nov 28th.
We also have a information packed infographic which captures the major data points of the Holiday Season Sales.
According to Adobe Analytics data, U.S. online sales returned to normal, indicating growth over the Thanksgiving weekend. Adobe’s Analytics tracks 1 trillion visits to U.S. retail sites, 100 million SKUs, and 18 product categories. Reaching $35.27 billion in web sales with a growth rate of 4%, it overtook 2020’s record of $34.36 billion in Cyber 5 web sales.
Here are the top ten takeaways for the holiday season.
#1 Foot Traffic is Up, But Still, Below 2019 Levels – Foot traffic for the Cyber Week grew over 40% year-over-year. With the majority of Americans vaccinated, shoppers now feel much safer buying in stores. Increased in-store shopping helped retailers with a hybrid model in place (offline and online/ BOPIS etc.) offset the decline in sales in one channel against another. For instance, Target saw a massive jump of 268% in foot traffic even though its online sales had flattened.
#2 Encouraging Climate for Online Retailers – Online sales of $35.27 billion is good news for online retailers. This is 4.0% higher than in 2021’s and 2.65% higher than in the 2020s. It shows resilient e-commerce spending and consumers’ capacity to drive moderate growth. This is indeed a very positive sentiment for the remainder of the holiday season, even though online sales didn’t grow this year at the same rate as offline sales. Amazon remained the king when it came to digital sales even though growth in online sales wasn’t as significant as in-store. Amazon reported an 85% revenue growth for the Cyber 5 period compared to last year.
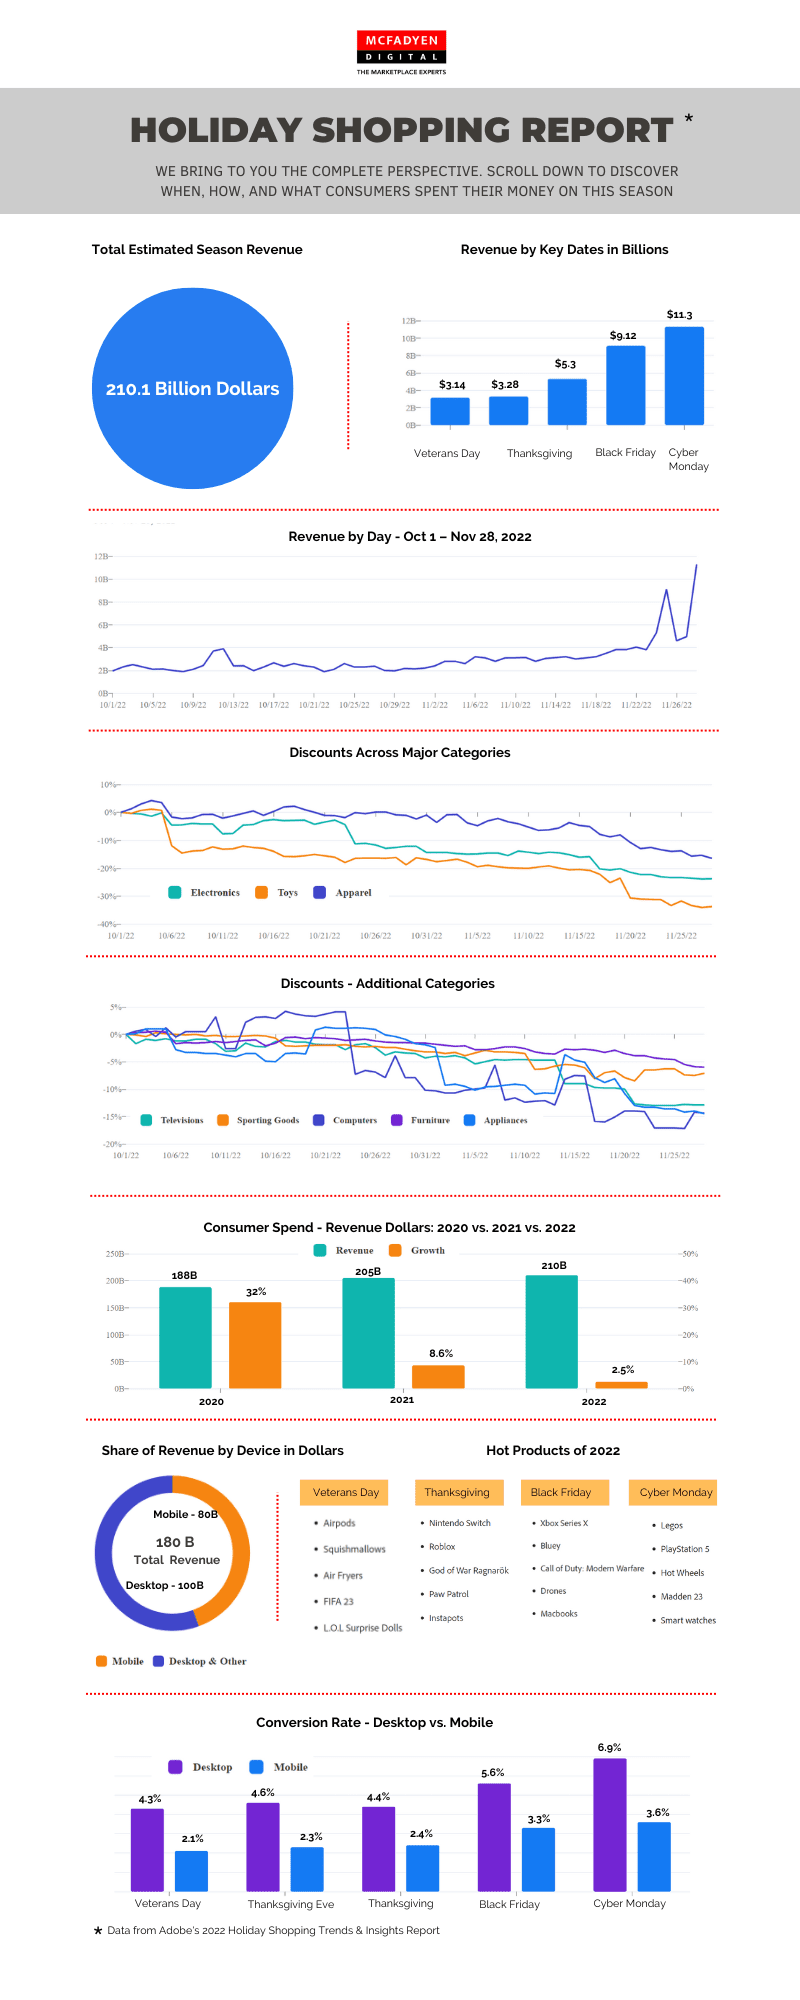
#3 Cyber Monday Rules – As per Adobe Analytics, Cyber Monday is still the biggest online sales day in the U.S., reaching $11.3 Billion in 2022. Black Friday is the second largest at $9.12 billion, followed by Thanksgiving at $5.29 billion. Cyber Monday also increased its share of sales over the Cyber 5 period to 32% compared to 31.5% in 2021, whereas Black Friday brought in 25.9% of Cyber 5’s sales and Thanksgiving 15.0%.
#4 Record Number of Shoppers – The merchants announced their deals early this holiday season. In fact, according to a Digital Commerce 360/Bizrate Insights survey of 1,088 online shoppers, around 26% of consumers said they start holiday shopping before September, 18% said they start in September/October, and 26% said early November. As per NRF, a record 196.7 million consumers shopped online and in stores over the Cyber 5 sales Thanksgiving through Cyber Monday period.
#5 Discounts Galore – One of the highlights of this season’s sale was the discounts. According to the data from e-commerce platform provider Salesforce Inc, the average online discount was 30% in the U.S. While many merchants/ retailers ran promotions through Oct and Nov, the shoppers waited for the Thanksgiving weekend to avail of the deep discounts. Salesforce data show a strong correlation between discount rates and digital sales, as consumers held out for the biggest and best deals. Here’s how discounts peaked on this Cyber Monday, and below is the comparison of discounts with 2021 across categories.
– Electronics: 25% off list price compared with 8% in 2021
– Toys: 34% off vs. 19% in 2021
– Computers: 20% off vs. 10%
– Television: 17% off vs. 11%
– Apparel: 18% vs. 13%
– Sporting goods: 10% vs. 6%
– Furniture: 8% vs. 2%
– Appliances: 16% vs. 4%
# 6 BOPIS was Appealing – This year’s holiday season found BOPIS extremely attractive for consumers. In the time leading up to the Thanksgiving weekend, many shoppers took advantage of the expedited shipping options to avoid supply chain-related delays. While BOPIS remained a decisive choice on other days of the holiday season, on Black Friday and Cyber Monday, standard shipping was what most consumers chose.
#7 Mobile Drove Holiday Sales – Mobile devices drove most of the sales during the Cyber 5 period. This time mobile devices generated 51% of the overall sales during Cyber 5 compared to 46% of the sales in 2021. In fact, Thanksgiving set a record with mobile devices driving 55% of online sales, a significant 4% jump from 51% last year. As for Cyber Monday, mobile sales accounted for 43% of this year, compared to 40% in 2021.
#8 But Conversion Higher on Desktop – While mobile drove more sales, when it came to conversions, it was a different story. As has been the trend during the holiday season, the conversion rates throughout Cyber Week 2022 were higher on desktop as compared to mobile. Overall desktop conversion rates for the Cyber week were 5.6% compared to 3.3% for mobile. On Cyber Monday, the desktop had a 6.9% conversion rate compared to mobile at 3.6%. It’s a known fact that consumers tend to buy items per order on desktop compared to mobile. For the cyber five sales period, the average desktop order contained 3.5 items compared to mobile at 2.9 items.
#9 Brand Sites Drove Shopping Traffic – Interestingly, the majority of Cyber Five online shopping traffic came directly to a brand’s website, also called direct traffic. This was the primary traffic source for 40% of shoppers. Organic search and social drove 25% and 10% of traffic, respectively. There wasn’t much variation on this throughout the different days of Cyber Week.
#10 The Impact of Inflation – Even with the rise in inflation and the overall cost of logistics, the shoppers still purchased more items this season compared to the last. Retailers and merchants ran heavy discounts to mitigate the impact of inflation. Overall, there was 3.5% year-over-year growth in online order value for the five-day cyber week period. The average order value also grew slightly compared to last year. While AOV saw a slight increase for Black Friday and Cyber Monday, it remained primarily flat for other days of the Cyber week.
CLOSING THOUGHTS
Digital commerce is evolving into a platform-based approach leveraging the marketplace model. The marketplace experts at McFadyen Digital are committed to helping you navigate the tumultuous marketplace landscape. We help our clients succeed throughout the development cycle through strategic market evaluation and building a business case to the build phase and launch, then continue the scalable maturation and iteration process. Check out our industry solutions offerings.
Sources
Adobe Analytics, 2022 Holiday Shopping Trends & Insights Report.
Salesforce, Retail Holiday Insights Research Report.
Digital Commerce 360 Cyber Five Highlights
Related Articles


Turn Insight Into Impact.
Start Today.