
Written by: McFadyen Digital
Reading time: 3 minutes
Updated: 04/29/2025
Published: 06/24/2021
It was another record-setting year for Amazon Prime Day, which was held on the 21st and 22nd of June. Pulling in an estimated $11.19 Billion according to Digital Commerce 360, total sales were up from $10.4 Billion in 2020. While this event was, by all means, a success, this isn’t the kind of year-on-year growth Amazon typically experiences, and is far short of the $13+ Billion estimates from some analysts prior to the start of the event. As has become the norm, Prime Day has a halo effect that sees competing retailers like Target and Walmart ran their own deals on Prime Day.
Let’s look at some of the key data points to better understand how Prime Day 2021 fared overall.
1. Marketplace Sellers Witnessed Better Growth
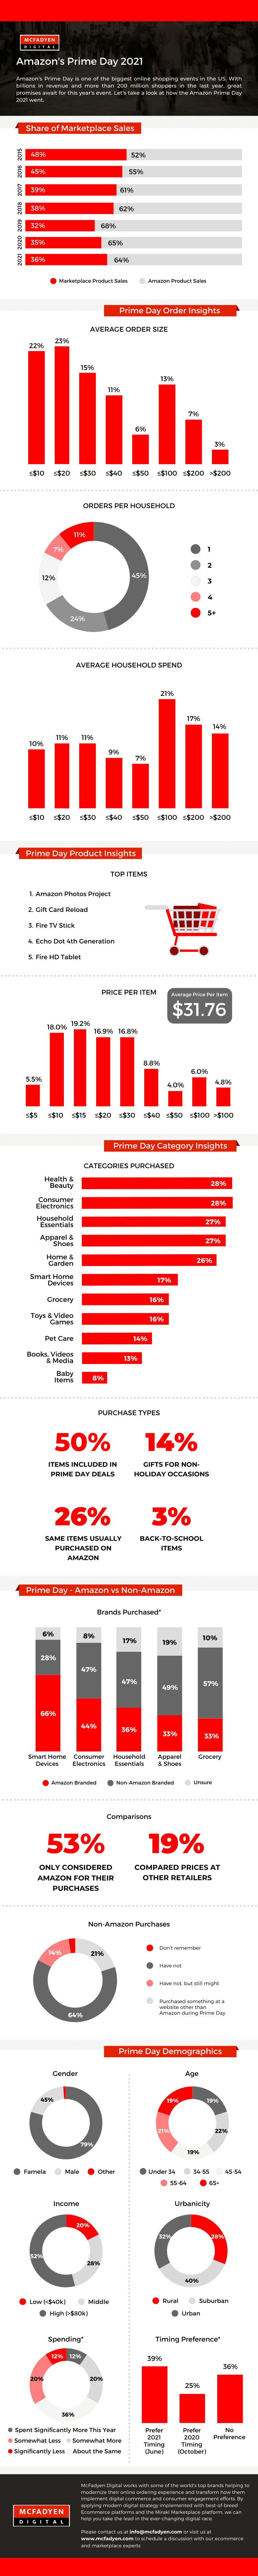
Just like last year, Amazon’s clear focus was on marketplace sellers. Amazon calls them small businesses. As per the estimates from Digital Commerce 360 sales of marketplace products grew 12%, whereas that of Amazon’s own product was at 5.3%. While there has been growth for marketplace sellers, but their share of sales had been declining prior to 2020 as Amazon heavily pushes its own products during the Prime day event. As per Digital Commerce 360 estimates marketplace seller account close to 33% of Prime Day sales
2. Order Size and Household spends
Close to 45% of orders were in the $10 to $20 range. Order size of $200 and over accounted for just 3% of the overall sales. When it came to orders per household 11% had over 5 order per household whereas most households at 45% had just 1 order. 21% of the household had less than a $100 spend whereas just 14% of the households had a spent of over $200.
3. Top selling Items
Amazon Photos Project was the top selling item across the two-day event followed by Gift Card Reload and Fire TV Stick. Last years top selling item was Echo Dot 3rd Gen. Close to 70% of the items fell in the $10 to #30. Average price per item was $31.76. There was small drop in the average spend compared to last year. It was $31.76 as compared to $32.65 in the year 2020.
4. Categories & Purchase Types
Health & Beauty, Consumer Electronics, and Household essential were the top 3 categories purchased. This was significantly different from last year when electronics was the largest selling category followed by apparels & shoes. Baby items was the lowest selling category. Close to 50% of the items purchased were part of the items included in the Prime Day deal. Just 3% of items account for Back-To-School purchases.
5. Amazon Vs Other Brands
As Amazon products stand heavily promoted during Prime Day event, it did show up in the sales. Smart Home Devices was the category that Amazon dominated with 66% of the overall sales. This was followed by consumer electronics where Amazon took a share of 44%. Grocery was the category which was dominated by Non-Amazon brands. When it came to Amazon versus the other brands 53% only considered Amazon for their purchases, whereas 19% compared the price at other retailers. Over 63% purchased items only at Amazon whereas 21% purchased products outside of Amazon during the Prime Day Sales.
6. Prime Day Demographics
When it came to gender 79% of the shopping population were females whereas males accounted for just 20%. Dominant shopping age group was 35-44 at 22%. Over 50% of the shoppers belonged to the high-income group of over $80K where 20% of the shoppers came from the low income group of less than $40K. Urban and sub-urban shopper together accounted for 72% of the total shoppers. Based on the numerator survey data 36% of the data said they would shop for almost the same this year, whereas only 12% mentioned that they would spend significantly higher this year. The same group when questioned about the time preference showed that 39% preferred June-July time as compared to just 25% who preferred last year’s October timing, 36% had no preference at all.
Summary
So overall it was another great Prime Day event as US consumer market returns to normalcy, even if the overall sales number wasn’t as spectacular as some had predicted. As per data from Adobe Analytics, total online retail sales in the United States during Prime Day were 6.1% higher as compared to the 2020 event. Online retail sales stood at $11 billion as compared $10.9 billion in the year 2020. As customers are returning to normalcy, there’s still a pent-up demand. The halo effect of Prime Event worked well for the overall retail industry especially the small online retailers.
Related Articles


Turn Insight Into Impact.
Start Today.